It was early Spring of September 7, 1936 and Benjamin, the last remaining Tasmanian Tiger/Wolf (scientific name: Thylacinus cynocephalus) was breathing his last breath in an enclosure of the Beaumaris Zoo in Hobart of the Australian island state Tasmania. It was a sad day for Australia, so much so that 7 September is still commemorated as National Threatened Species Day every year.
That was almost 88 years ago, but the Thylacine's voice is not completely silent. With the power of DNA sequencing one can still discover its secrets by comparing its genome sequence against the genome of other living Australian mammals like the Tasmanian Devil (Sarcophilus harrisii).
Here is an image of a Tasmanian Devil
Both of these animals are carnivorous, both are marsupial mammals. The gestation period of the Thylacine was 28 days while that of the Tasmanian Devil is 21 days. When they are born in a relatively immature state they have to crawl into the pouch of the mother where they have to find one of the available teats where they will complete their further development . Both animals has/had a rear facing pouch and both had four teats.
Looking at the images one would be excused for thinking that the Thylacine/Tasmanian Tiger is more closely related to the Dog or the Wolf, but the Thylacine and the Tasmanian Devil only have 7 pairs of chromosomes (12 autosomal and 2 sex chromosomes) while the Dog and the Wolf have 39 pairs of chromosomes (76 autosomal and 2 sex chromosomes) which are considerably different from that of the Thylacine and the Tasmanian Devil.
You can read more on the relatedness of the Thylacine with Australian animals in the following articles:
Both these files need to be unzipped into a folder such as : FastaThylacine or FastaTasmanianTiger or FastaTasmanianWolf below where your genomes are in the data folder.
The next step is to ask the Genome Browser to refresh its detected folders:
This action will rebuild the 2bit genome file from the fasta/fsa file and the GFF annotation file. On my PC it looks as follows after this step:
When you have completed these steps you will have the 2 animals' genomes available for selection in the folder combo box:
When you select the genome of the Tasmanian Wolf and also click on the Load genes button, the chromosomes will be shown as scaffolds and you will see a view like this:
Now you need to open the Control panel by clicking on the following button:
Next step is to set the Thylacine genome as the "Other genome" which you will be comparing by double clicking on the bottom Overlay text box.
It should set the position as well as turn pink.
Next step is to load the Tasmanian Devil genome by selecting it from the Folder combo box.
Then, after it is loaded and you have clicked the "Load Genes" button, you double click in the top overlay text box next to the red "This".
Now both genomes will be loaded and ready for further comparison.
You should see something like this:
Now that both genomes are ready, we are going to use the KmerDb tool to do a k-mer comparison between all the chromosomes of the Thylacine and all the chromosomes of the Tasmanian Devil to determine which chromosome from each animal corresponds to the same chromosome in the other animal. It will essentially calculate the Jaccard similarity between each chromosome and then provide the results in an Overlay table.
This might take a considerable time, and when it is finished it will show you the table with the corresponding chromosomes of this genome (Tasmanian Devil) in the Rows and the Other genome (Thylacine) in the Columns.
The next time you click on the "Create or Read table" button it should take much less tie as it saved the table in a CSV file for later use.
Next step is to create a DOT Plot display using Minimap2 for all the likely matching chromosomes between the 2 animals. This can be done in 2 ways:
If you want to do it manually, you can simply double click on the matching column and then click on Full Align which will proceed to use Minimap2 to create a PAF file that is used to create a DOT plot for the full alignment between the 2 sequences. Make sure you have enough RAM, otherwise you will need to select the "Low mem" option which runs much longer but uses less memory.
When it is finished building a dot plot, you will see it in the Dot Plot tab of the bottom panel
You can move the mouse over the DOT Plot to see which genes in both genomes are found at that position as well as get a local alignment of the DNA at that position.
The Current (This) genome runs along the Y axis and the Other genome sequence runs along the X-axis.
Green is used to indicate a match in the forward direction and purple indicates a match in the reverse complement.
When you double click in the DOT Plot at the start of a region and CTRL + double click at the end of the region it will display the genes from both genome sequences found in that region.
The dot plot display also allows you to "ALIGN" the sequences from the 2 genomes based on the CIGAR strings for the alignments found in the PAF file generated by the Minimap2 process.
You can do this by holding in the SHIFT key and double clicking at a specific position in the DOT plot.
This action will correctly set the positions in both genomes in order that the Zoom DNA view is at the spot where the 2 sequences can be exactly overlaid on top of each other. You can switch the Zoom DNA view between 3 modes: Overlay, No Overlay and Aligned Overlay (where local alignment is used to display the 2 genome sequences with colour coded letters). But the gene annotations will only be displayed in the Overlay mode.
When you are in the Overlay mode of the Zoom DNA view, you can even right click to access the genes in both genomes at that position.
If you now select the "Copy Protein to clipboard + Comparisons" option for both "Zinc finger proteins" in the 2 genomes it will copy the protein sequences to the Comparisons so you can do further analysis on them.
A very powerful feature after you have calculated the Minimap2 Full alignment Dot Plot between the 2 sequences is to Switch to the Comparisons Tab and then
Next select Fast Global Alignment
It is important to select this Fast option, as it uses optimised code to align sequences at speeds which are orders of magnitude faster than the other options. The other options are only used to align individual sequences against each other when you want to obtain colour coded output or want to use PAM substitution matrices with protein sequences.
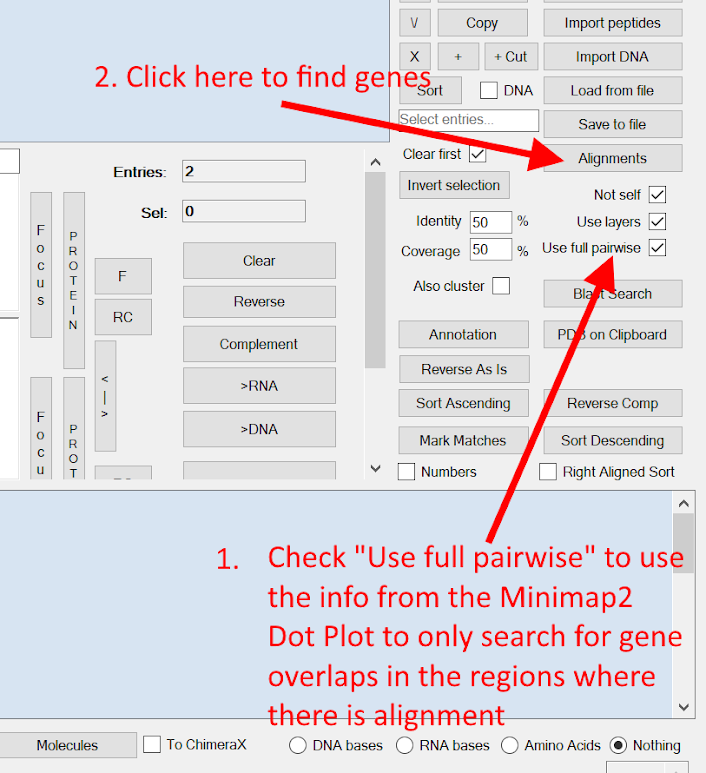
Then check the "Use full pairwise" checkbox and after that click the "Alignments" button to find the genes from both genomes from the positions with best alignment.
The Identity and Coverage text boxes can be used to set the stringency of the matches. (Coverage is only used when you selected Fast Local Alignment in the previous selection instead of Fast Global Alignment)
The Alignments button is usually used when you have copied several Comparison entries against each other (when you have unchecked Use Layers) or when you want to Align the currently selected Comparison entries against the genes in the currently displayed genome sequence (when you have checked Use Layers). This normally does an ALL to ALL comparison between them all to find the best alignments across the entire sequence's annotated genes. The Use full pairwise option attempts to speed up this search by only searching within the Minimap2 alignment output where we have already determined that there is a high degree of similarity.
You will get the following popup:
The search process will take several minutes, but still much quicker than if you had to do a full brute force search between all of the annotated genes of the Tasmanian Devil and all of the comparisons loaded from the Thylacine.
The result is a list of 1240 genes from the Tasmanian Devil with high similarity with genes in the Thylacine. The output is displayed in the Gene Search Results tree.
You can zoom the tree by holding down the CTRL key and rolling the mouse wheel. The results are ordered in descending order from highest score to lowest score. (The score is a measure of both the alignment length and the identity %)
When you double click on the main tree node, it will position the Zoom DNA view at the position of the gene in the current Tasmanian Devil's genome.
You can also right click on the entries to get various menu options:
And most importantly, when you double-click on the entry containing the =>98.4%, the Browser will take you to a pairwise alignment between the 2 protein sequences in the Comparisons Tab.
This is the output of the fast method.
This is now where you can select one of the slower alignment methods such as Blosum90Global which will relax the matching criteria to take into account that amino acids can normally be substituted in nature for others and still result in a similar folding pattern in the protein.
The BLOSUM90 matrix assigns scores to amino acid substitutions based on their observed frequencies in related protein sequences. It provides higher scores for more similar amino acids and lower scores for less similar ones. Substitution matrices come in various forms, with the most common ones being BLOSUM (BLOcks SUbstitution Matrix) and PAM (Point Accepted Mutation) matrices.
When you want to re-run the alignment, you can click on the Edit Distance button or simply double click on the =>98.4% node again.
Now you get a colour coded pairwise alignment where Hydrophobic amino acids are pink, Polar (Uncharged) ones are blue, Polar (+) ones are a Cyan colour and Polar (-) ones are green. It will sometimes also show the start of the Exons in Red. It helps you to see when similar amino acids were substituted for others.
Another quick way to get an alignment is to simply start typing the gene name in the Gene Search box and the Genome Browser will match the corresponding genes in both genomes.
You can now just press CTRL + ENTER to do the same alignment with different genes.
After you have navigated to any gene position you can instantly overlay their sequences by clicking on the 'A' button, which will use the CIGAR strings in the Minimap2 alignment to position the genomes so that the overlay in the Zoom DNA view.
When you now switch to the "Align" view, you can see the DNA regions on the corresponding chromosomes aligned in the Zoom DNA view.
Getting back to the DOT Plot images for the Minimap2 full pairwise alignments, they can be found in the following temporary folder for the Tasmanian devil in case you want to use them elsewhere:
When you need to create all of the DOT PLOT images for all of the likely matching sequences, you can use a batch mode which will take some time but will eventually pre-calculate them all for you.
This concludes what I want to explain on how to use the Visual Genome Browser to compare the genomes of the Tasmanian Tiger/Wolf with that of the Tasmanian Devil.